Dynamic Channels in Biomolecular Systems: Path Analysis and Visualization
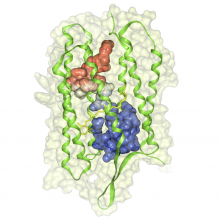
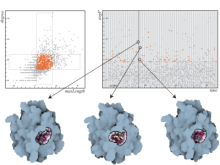
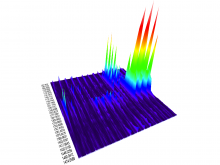
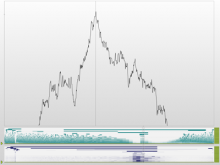
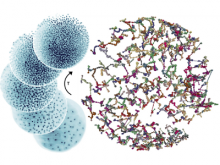
Analysis of protein dynamics suggests that internal cavities and channels can be rather dynamic structures. Here, we present a Voronoi-based algorithm to extract the geometry and the dynamics of cavities and channels from a molecular dynamics trajectory. The algorithm requires a pre-processing step in which the Voronoi diagram of the van der Waals spheres is used to calculate the cavity structure for each coordinate set of the trajectory. In the next step, we interactively compute dynamic channels by analyzing the time evolution of components of the cavity structure. Tracing of the cavity dynamics is supported by timeline visualization tools that allow the user to select specific components of the cavity structures for detailed exploration. All visualization methods are interactive and enable the user to animate the time-dependent molecular structure together with its cavity structure. To facilitate a comprehensive overview of the dynamics of a channel, we have also developed a \ visualization technique that renders a dynamic channel in a single image and color-codes time on its extension surface. We illustrate the usefullness of our tools by inspecting the structure and dynamics of internal cavities in the bacteriorhodopsin proton pump.
BioVis 2012 Information
