enRoute: Dynamic Path Extraction from Biological Pathway Maps for In-Depth Experimental Data Analysis
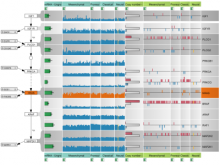
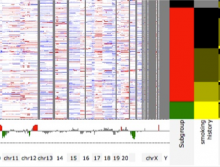
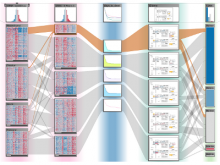
Pathway maps are an important source of information when analyzing functional implications of experimental data on biological processes. However, associating large quantities of data with nodes on a pathway map and allowing in depth-analysis at the same time is a challenging task. While a wide variety of approaches for doing so exist, they either do not scale beyond a few experiments or fail to represent the pathway appropriately. To remedy this, we introduce enRoute, a new approach for interactively exploring experimental data along paths that are dynamically extracted from pathways. By showing an extracted path side-by-side with experimental data, enRoute can present large amounts of data for every pathway node. It can visualize hundreds of samples, dozens of experimental conditions, and even multiple datasets capturing different aspects of a node at the same time. Another important property of this approach is its conceptual compatibility with arbitrary forms of pathways. Most notably, enRoute works well with pathways that are manually created, as they are available in large, public pathway databases. We demonstrate enRoute with pathways from the well-established KEGG database and expression as well as copy number datasets from humans and mice with more than 1,000 experiments. We validate enRoute using case studies with domain experts, who used enRoute to explore data for glioblastoma multiforme in humans and a model of steatohepatitis in mice.
BioVis 2012 Information