Extending The Grammar of Graphics for Biological Data Visualization

Poster
Tengfei Yin, Dianne Cook, Michael Lawrence

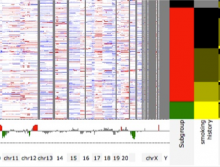
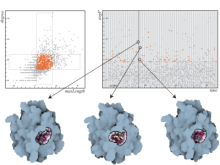
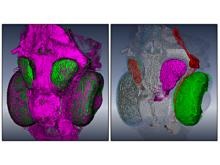
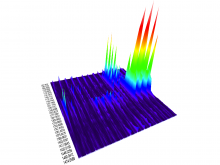
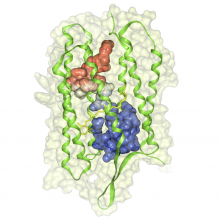
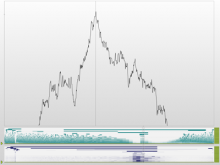
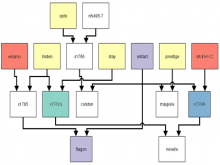
This work extends the grammar of graphics into the domain of genomic data visualization, focusing on next generation sequencing data. It develops object oriented design to utilize charting taxonomies with a goal to improve consistency in plots of biological data. The work builds on the grammar of graphics in ggplot2 in R, and makes use of the extensive statistical functionality and data processing in Bioconductor. The new R package is called "ggbio". This work aims to shed light on biology-specific visualization and the design of graphic with biological data analysis and modeling.

BioVis 2012 Information

The New UCSC Cancer Genomics BrowserUser-guided Segmentation of Thoracic Computed Tomography Data for Electrical Impedance Tomography Image ReconstructionVisualization and Exploration of 3D Toponome DataTractography in Context: Multimodal Visualization of Probabilistic Tractograms in Anatomical ContextUsing a Mathematical Graph Framework for Visualization of Inheritance Patterns in Commercial Plant PedigreesExtending The Grammar of Graphics for Biological Data VisualizationcompreheNGSive: A Tool for Exploring Next-Gen Sequencing VariantsMedSavant: Visual Analytics for Genetic Variation DatasetsBulk Synchronous VisualizationGetting Into Visualization of Large Biological Data SetsAracari: exploration of eQTL data through visualizationAn Abstract View of Associations Between Diseases and Developmental Gene SetsCan Adjacency Matrices help in the exploration and understanding of Multi-Omics Data?StratomeX: Enabling Visualization-Driven Cancer Subtype AnalysisGenomeRing: alignment visualization based on SuperGenome coordinatesScalable Interactive Analysis of Retinal Astrocyte NetworksVisual Analysis of Genome-wide Tracts of Homozygosity