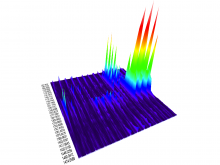
INCIDE the Brain of a Bee: Visualising Honeybee Brain Activity in Real Time by Semantic Segmentation

Paper
Martin Strauch, Marc P. Broeg, Clemens Müthing, Paul Szyszka, Oliver Deussen, C. Giovanni Galizia, Dorit Merhof

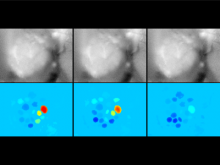
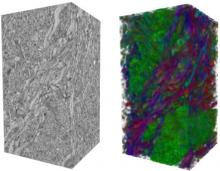
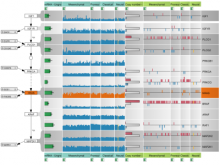
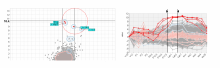
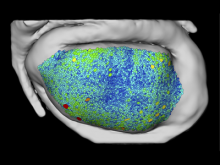
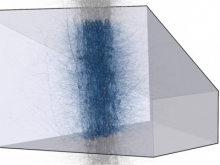
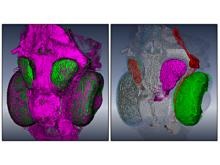
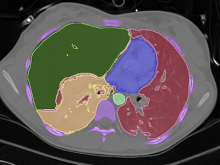
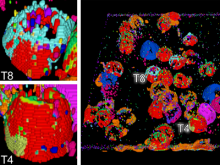
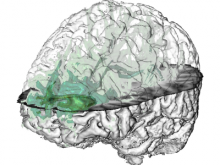
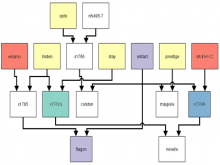
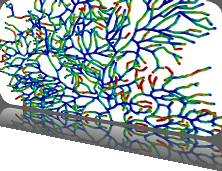
We present a software solution for processing recordings of honeybee brain activity in real time. In the honeybee brain, odors elicit spatio-temporal activity patterns that encode odor identity. These patterns of neural activity in units called glomeruli can be recorded by calcium imaging with fluorescent dyes, but so far glomerulus segmentation was only possible offline, making interactive experiments impossible. \ Our main contribution is an adaptive algorithm for image processing, along with a fast implementation for the graphics processing unit that enables semantic segmentation in real time. Semantics is based on the temporal dimension, relying on the fact that time series of pixels within a glomerulus are correlated. \ We evaluate our software on reference data, demonstrate applicability in a biological experiment, and provide free source code. This paves the way for interactive experiments where neural units can be selected online based on their past activity.

BioVis 2012 Information

The New UCSC Cancer Genomics BrowserUser-guided Segmentation of Thoracic Computed Tomography Data for Electrical Impedance Tomography Image ReconstructionVisualization and Exploration of 3D Toponome DataTractography in Context: Multimodal Visualization of Probabilistic Tractograms in Anatomical ContextUsing a Mathematical Graph Framework for Visualization of Inheritance Patterns in Commercial Plant PedigreesExtending The Grammar of Graphics for Biological Data VisualizationcompreheNGSive: A Tool for Exploring Next-Gen Sequencing VariantsMedSavant: Visual Analytics for Genetic Variation DatasetsBulk Synchronous VisualizationGetting Into Visualization of Large Biological Data SetsAracari: exploration of eQTL data through visualizationAn Abstract View of Associations Between Diseases and Developmental Gene SetsCan Adjacency Matrices help in the exploration and understanding of Multi-Omics Data?StratomeX: Enabling Visualization-Driven Cancer Subtype AnalysisGenomeRing: alignment visualization based on SuperGenome coordinatesScalable Interactive Analysis of Retinal Astrocyte NetworksVisual Analysis of Genome-wide Tracts of Homozygosity