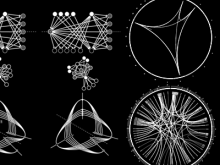
Similarity Analysis of Cell Movements in Video Microscopy
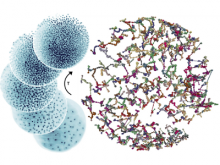
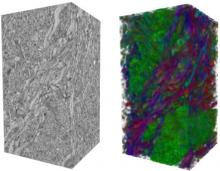
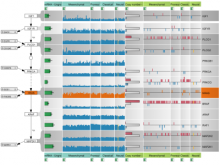
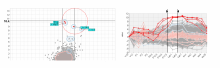
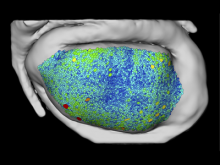
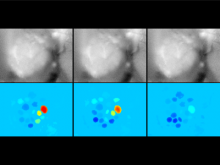
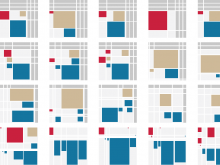
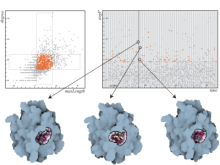
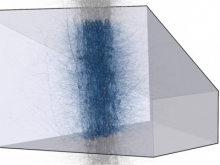
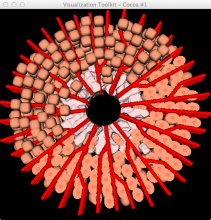
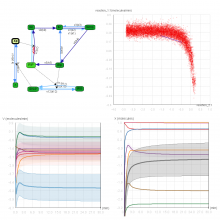
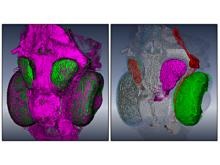
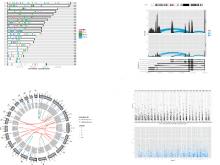
Modern 3D+T video microscopy techniques enable biologists to \ acquire data of living organisms with unprecedented resolution in \ time and space. These datasets contain a wealth of biologically \ relevant and quantifiable information, e.g. the movements of all individual \ cells in a complex organism. However, extraction, validation, \ and analysis of this information are both challenging and timeconsuming. \ In this paper, we present a computational technique \ that classifies and validates similar patterns of cell movements and \ cell divisions in organisms that consist of up to thousands of cells. \ Our algorithm determines tracking paths of traced cells that exhibit \ similar features and shape structures. These similarity values are assigned \ to our cluster algorithm that clusters paths into groups of coherent \ behavior. The data can be interactively explored in 2D projections \ and a 3D cell movement representation. For the first time, \ this visualization allows biologists to exhaustively assess similarities \ and differences in division patterns and cell migration on the \ scale of an entire organism. For validation, we applied our method \ on a synthetic dataset and two real datasets including zebrafish periods \ from blastula stage to early epiboly and growing zebrafish tail. \ We show that our method succeeds in detecting similarities based \ on shape and cell-movement based features.
BioVis 2012 Information