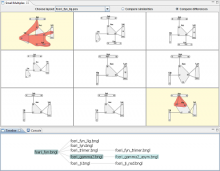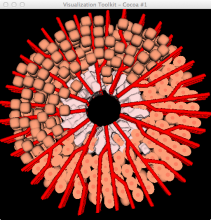
zTree: Interactive 3D Visualization of Combinatorial DNA Libraries
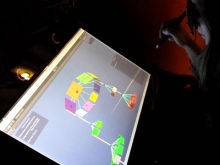
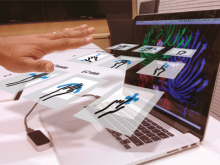
Synthetic biologists apply engineering approaches to build new biological systems. These synthetic circuits, which are composed of biological parts (characterized DNA sequences) have numerous potential applications in therapeutics, environmental decontamination, and bio sensing. The design space of biological systems with specified behavior can be explored in a combinatorial fashion through the composition of natural and synthetic biological parts. Such process can involves a large number of primitive and composite parts. The goal of ours project is to explore the use of 3D visualizations for navigating and understanding combinatorial part libraries. We developed an interactive 3D visualization of DNA libraries called zTree. It draws upon Parc's Cone Trees visualization technique for hierarchical information. The top of the hierarchy represents a particular library, nodes are drawn like index cards and represent a part type (marked using Synthetic Biology Open Language) or a concrete biological part. Our goal is maximize effective use of space to enable visualization of an entire library, while providing an Overview plus Details interface, which allows users to perform high-level tasks such as selecting a collection of biological parts, recognizing optimal assembly tree (minimum number of stages and steps), and identifying the structural diversity within a particular set of parts. zTree is implemented using a holographic stereoscopic display called zSpace, which tracks the user's head and hand position to provide enhanced immersive cues and direct manipulation of 3D objects using a stylus. The current implementation of zTree visualizes the MIT Library of Biological Parts, which contains about 3500 parts.
BioVis 2013 Information