BioTapestry: Version 7 Introduces New Features and New Architecture
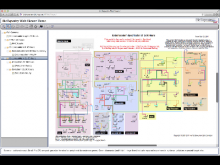
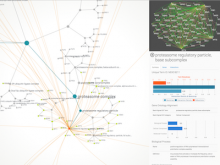
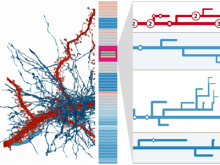
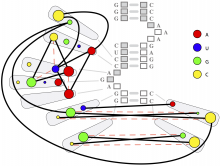
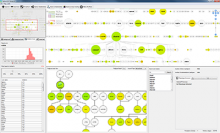
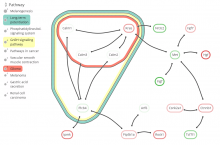
BioTapestry is a well-established tool for building, visualizing, and sharing models of gene regulatory networks (GRNs), with particular emphasis on the GRNs that drive development. BioTapestry features a hierarchical modeling framework that presents multiple views of the network at different levels of spatial and temporal resolution. This approach is well-suited to depicting the GRNs of an embryo that increases in spatial complexity over time. Static network images are of limited utility for understanding such complex systems, so the ability to share interactive GRN models over the Web becomes increasingly important as researchers continue to build ever-larger GRN models. While the Java Web Start BioTapestry Viewer has filled this role up to the present, current Web technology trends indicate a browser-based web application using technologies such as JavaScript and HTML5 Canvas will experience better long-term support. We have created such a pure browser-based BioTapestry Viewer, which will be part of our upcoming BioTapestry Version 7 release. This new release is based upon a redesigned architecture that supports both the server-side component of the new Web Viewer application as well as the existing complete BioTapestry Editor Java desktop application. The next BioTapestry release will also include improvements to the automatic layout algorithms. BioTapestry's "circuit trace" link drawing technique is highly scalable, and so BioTapestry can also be used to create rational and organized diagrams of large directed networks. Version 7 will feature both increased layout efficiency as well as new techniques for organizing target nodes.
BioVis 2014 Information