MIMTool: A Tool for Drawing Molecular Interaction Maps
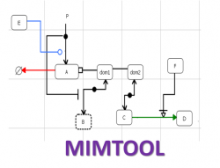
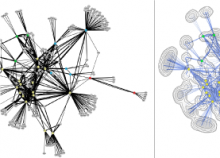
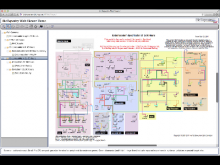
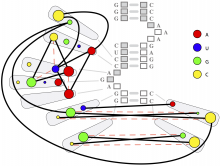
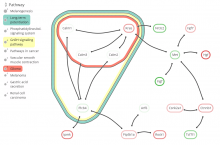
Background: To understand protein function, it is important to study protein-protein interaction networks. These networks can be represented in network diagrams called protein interaction maps that can lead to better understanding by visualization. We address the problem of drawing of protein interactions in Kohn's Molecular Interaction Map (MIM) notation. Even though there are some existing tools for graphical visualization of protein interactions in general, there is no tool that can draw protein interactions with MIM notation with full support.
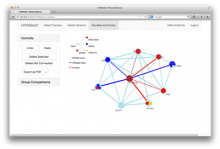
Results: MIMTool was developed for drawing protein interaction maps in Kohn's MIM notation. MIMTool was developed using the Qt toolkit libraries and introduces several unique features such as full interactivity, object dragging, ability to export files in MIMML, SBML and line drawing with automatic bending and crossover minimization, which are not available in other diagram editors.
Conclusions: MIMTool facilitates faster drawing, updating and exchanging of MIMs. Among its several features, it also includes a semi-automatic drawing algorithm that makes use of shortest path algorithm for constructing lines with small number of bends and crossings. MIMTool contributes a much needed software tool that was missing and will facilitate wider adoption of Kohn's MIM notation.
BioVis 2014 Information
