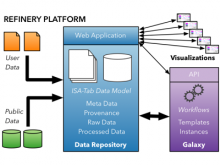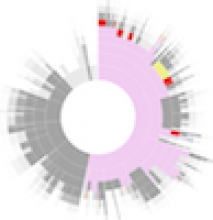
Treemap Visualization of Personal Genomic Reports
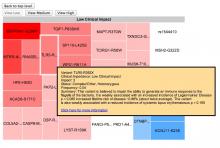
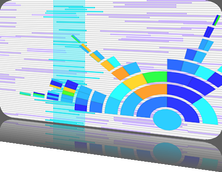
Interactive, online personal genomic data is increasingly available to non-experts and influences their decisions, emotional state, and well being. However, there is little research on the visualization of personal genomic data for non-experts. Our study of non-expert interaction with personal genomic information indicates that users often begin their engagement with personal genomic information with an online report. Such reports provide high-level summary of annotated genomic information in a tabular view, including a list of gene variants associated with particular conditions along with calculated genetic risk based on the individual's genotype. Additional information is available through links. While the tabular view offers familiarity and overview, the reliance on textual information (containing complex scientific terminology) limits the effectiveness of the reports. To overcome these limitations, we present a Treemap visualization of a personal genomic report: gene variants are mapped to rectangles and are grouped by their clinical importance: Low, Moderate, and High. The size of the rectangles corresponds to their clinical importance. The color represents the impact of a particular gene variant: pathogenic, benign, or protective. The saturation of the color represents the certainty of the scientific findings determining the impact of a gene variant, saturated colors map to high certainty. Additional information about the gene variant including a summary is presented upon selection of a particular rectangle. Preliminary findings from an evaluation with 42 Personal Genome Project users show that users favored this visualization and were able to make sense of the information while identifying areas of concerns.
BioVis 2014 Information