RNA-SequenLens for Visualizing RNA Secondary Structures
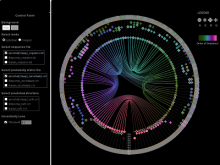
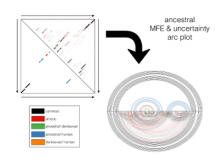
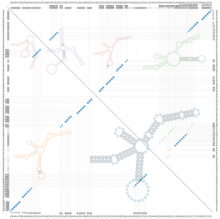
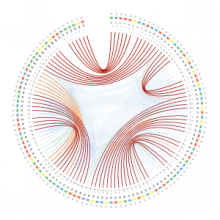
[Design Contest Entry] Traditional RNA structure visualization methods (e.g. dot-plots, arc diagrams, graphs) have limitations such as: (1) with dot-plot and arc diagram, possible pairing nucleotides are not easily perceived, therefore it is difficult to compare RNA structures; (2) rainbow colors are often adopted, which can not reveal the characteristics of data that has implied ordering. Here, we introduce “RNA-SequenLens” to address above problems and the visualization tasks raised in the re-design contest.
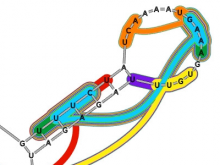
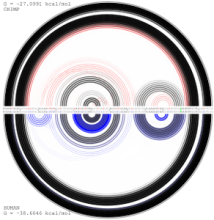
In our visualization: (1) a RNA sequence is displayed circularly in the inner most circle, then color is used to encode the order of nucleotides on the RNA sequence. (2) A probability meter is plotted for each nucleotide of a sequence. On the probability meter of a nucleotide, all its possible pairing nucleotides are displayed sequentially based on probabilities. The closer the pairing nucleotides to the center, the higher the probability. Paring links are used to link possible binding nucleotide pairs. (3) A probability filter is introduced to allow the interactive visualization of pairing possibilities at the desired threshold. By interactively changing the size of the probability filter, paring links of different probabilities will be displayed in the center. (4) The visualization of predicted RNA secondary structures can be considered as a special case of uncertainty visualization where the threshold probability is fixed. Then, for comparison, we can highlight the differences between two RNA sequences and their predicted secondary structures.
[Acknowledgement: this work is sponsored by the Labex Numev (convention ANR-10- LABX-20)]
BioVis 2015 Information